The budget that ate San Francisco
The Budget That Ate S.F: A Study of San Francisco Taxation
and Spending is sponsored by the Committee on Jobs. Thanks to
Baha Hariri, the San Francisco Office of the Controller, the members
and leadership of the San Francisco Building Owners and Managers
Association, and the Mayor's Office of Economic and Workforce
Development. A special thanks to Christopher Wright for his tireless
efforts in shedding light on excessive city spending and his dedication
to a better San Francisco.
July 18, 2006
INTRODUCTION - "Round Up The Usual Suspects"
As Captain Renault in Casablanca, the actor Claude Rains made
himself immortal by telling his men to "round up the usual
suspects." Years later, the film "Usual Suspects"
would borrow the phrase and give birth to another well known character:
Kaiser Soze, the unseen crime lord responsible for everything,
but seen by no one. Often referred to as conventional wisdom,
urban legends or old wives' tales, these half-truth/half-fiction
morality tales make for great cinema because of what they say
about society. We often believe what we hear, especially if we
hear it over and over again.
A good example of urban myth overtaking reality can be found
in an Francisco, where the City's ideological government leaders
ave misled the public for years into believing that the business
ommunity contributes very little financially to help run the City.
othing could be further from the truth. The reality is that the
an Francisco Board of Supervisors has, for years, leaned on the
downtown" to support its runaway municipal spending. Year
after year, San Francisco's elected officials struggle to balance
the City budget, failing to control spending and continually seeking
new revenues from businesses and residents in the form of taxes
and fees. Despite the fact that the City is still only slowly
recovering from a serious economic downturn, San Francisco's fiscal
year (FY) 2005-06 budget reached an all-time high of $5.3 billion.
That didn't stop City Hall from proposing a FY 2006-07 budget
that calls for even more spending, with a more than 8% increase
totaling a massive $5.73 billion.1
All the while, the City has consistently dragged its feet on
conducting key audits of departments and economic analyses of
pending legislation-even though voters approved Proposition I
two years ago requiring just such analyses. The San Francisco
Health Department, for example, enjoys a budget in excess of $1.2
billion, but has never been fully audited.2 The Board of Supervisors
routinely considers and attempts to impose new fees and taxes
on businesses, again, without conducting the economic analysis
that Proposition I requires. Though the City has adopted hundreds
of pieces of legislation since Prop. I's passage, it has conducted
only a handful of economic impact reports.
The dire lack of cost containment, however, doesn't appear to
concern the majority of San Francisco's elected leaders and special
interests. They simply maintain that the problem is revenue. Falling
back on their favorite urban myth, they try to convince us that
businesses can pay more, they don't pay enough…they must
pay their fair share.
This paper is designed to combat what amounts to nothing more
than a damaging urban myth, one that has had far-reaching economic,
financial and political ramifications for businesses, residents
and taxpayers. This study examines revenue from different taxes
collected by the City and County and analyzes the contributions
specific to the downtown region, where the majority of the City's
retail and commercial businesses operate. The results are troubling.
San Franciscans enjoy a host of expensive city services paid
for by local tax dollars that, as the data shows, are generated
in large part by the downtown. It is quite astounding that a region
making up just 5% of the City's total area provides more than
a third of total General Fund revenues-$1.2 million every day
to the General Fund from just the major taxes. The downtown pays
more in taxes than any other area of San Francisco, with the bulk
coming from local businesses already struggling to "make
it" in a city known for its notoriously high cost of living
and exorbitant cost of doing business.
The amount of taxes actually paid is much more than what is noted
above, yet hundreds of millions of dollars in revenue go directly
to other funds such as the SF Unified School District and other
local government agencies called enterprise departments, including
the airport, Public Utilities Commission, and the public transportation
system. The above figure only accounts for the portion of taxes
that end up in the General Fund, the City's main operating account.
Moreover, this study did not consider downtown's hefty payments
into the City's elaborate fee system, which brought in more than
$350 million last year alone in governmental charges and more
than $1.68 billion in business-type fees.3 For these reasons,
this report dramatically understates the total financial contribution
that downtown makes to the City. However, it offers a snapshot
of the many millions of dollars that a small cross section of
the City provides, and how the political rhetoric of "fair
share" is being misused to mask City Hall's catastrophic
spending problem. The reality is that there can never be enough
revenue for a city whose budget grows by more than a billion dollars
every few years.
A LOOK AT THE NUMBERS - Locating Downtown
Geographically, the downtown is situated in the northeast corner
of the City and comprises about 2.5 square miles of San Francisco's
47 total square miles, or roughly 5% of the City in terms of area.4
This small region contributes more money to City coffers than
any other part of the City and, in some cases, more than the rest
of the City combined.
Revenue Generated By Dowtown
The City and County of San Francisco's ever-growing budget is
funded largely through billions of dollars in taxes and revenue
from fees, licenses and fines, among other funding sources. Not
all of this revenue goes into the City's main operating account-
the General Fund. Portions are appropriated to fund other specific
services, such as transportation and education.5 This study looks
at the following major taxes, their contribution to the General
Fund and the hundreds of millions of dollars the downtown region
contributes:
- Payroll Tax
- Commercial Property Tax
- Business Registration Tax
- Hotel Tax
- Franchise Tax
- Sales Tax
- Utility Users Tax
- Parking Tax
1. PAYROLL TAX
Downtown paid $132 million in payroll taxes in FY 2004-05, accounting
for nearly half of the City's entire payroll revenue stream.6
San Francisco's General Fund collected $284.41 million in payroll
taxes in FY 2004-2005 by levying a 1.5% tax on businesses for
all payroll expenditures. The downtown's contribution of $132
million makes it San Francisco's chief source of payroll tax revenue.
In other words, 5% of the City's geographic area accounted for
roughly 50% of the City's payroll tax. It is important to note
that small businesses are exempt from this tax and thus the City's
revenue depends solely on local medium- to large-size businesses.
2. BUSINESS REGISTRATION TAX
Downtown contributed more than one quarter of the revenue that
the City receives from the business registration tax.7 In addition
to payroll taxes, San Francisco companies must also pay an annual
business registration tax based on their computed payroll tax
liability. In hard dollars, the downtown in FY 2004-05 contributed
about $2 million of the total $7.36 million the City collected
from the business registration tax.
3. FRANCHISE TAX
Downtown accounted for nearly ALL of the revenue collected.8
The City and County of San Francisco in fiscal year 2004-05 collected
$12.79 million in franchise taxes from companies that pay to use
the City's streets, or rights-of-way. This fee allows them to
provide services to residents, such as cable, phone and Internet
service. Of that amount, downtown paid $12.53 million, or nearly
all of the revenue the City received from the franchise tax.
4. UTILITY USERS TAX
Downtown businesses paid more than $16 million in utility users
tax in FY 2004-05.9 San Francisco's utility users tax, which is
collected by PG&E and then paid directly to the City on a
monthly basis, is a 7.5% tax levied on all businesses for their
use of energy. Residential users are exempt. Last year, the City
collected $72.57 million from the utility users tax, with downtown
businesses paying $16.1 million.
5. COMMERCIAL PROPERTY TAX
Downtown paid more than $100 million in commercial property tax
in FY 2004-05.10 The City's General Fund received roughly $154
million in revenue from commercial property taxes in FY 2004-05,
with the downtown region contributing about $101 million. In other
words, the downtown generated more than twice the commercial property
tax revenue as the rest of the City combined.
6. HOTEL TAX
Downtown generated more than $87 million in hotel tax payments
in FY 2004-05, representing 80% of the entire revenue stream.11
The City and County of San Francisco collects a 14% hotel tax,
also known as the transient occupancy tax, on all hotel room charges.
The tax has grown from an initial rate of 6% to its current level
of 14%, making it the highest hotel tax rate of any Bay Area city
and the second highest hotel tax rate in the state.
In FY 2004-05, the City's General Fund received $109 million
in hotel tax revenue, with the downtown contributing 80%-90%,
according to industry experts. Using even the most conservative
percentage (80%), the downtown generated more than $87 million
of the $109 million in General Fund hotel tax revenue in FY 2004-05.
7. SALES TAX
Downtown generated more than $41 million in General Fund sales
tax revenue in FY 2004-05.12 San Francisco's sales tax rate of
8.5% is the highest in the Bay Area. In fact, it is the highest
sales tax rate of any major California city. The tax is imposed
on the sale of all tangible personal property, including business-tobusiness
sales. It is responsible for funding the City's schools, transportation
system and general local government.
The downtown is the City's chief generator of sales tax revenue,
bringing the General Fund $94.69 million in FY 2004-05. Again,
this represents only the portion of tax revenue that goes directly
to the City's General Fund. It does not include large portions
that are paid to state and local transportation and school funds.
Of the $94.69 million General Fund portion, the downtown was responsible
for generating $41.66 million, almost as much as the rest of the
City combined.
8. PARKING TAX
Downtown generated $26 million in General Fund parking tax revenue
in FY 2004-05, or 78% of total revenue.13 The City and County
of San Francisco charges the highest parking tax rate in the country,
almost triple that of the City of Los Angeles and outpacing even
downtown Manhattan. Most cities do not charge a parking tax, including
the cities of San Jose, Sacramento and San Diego. In addition,
San Francisco's enormous tax rate of 25% is five times the state's
average 5% parking tax rate.
The City collected $55.15 million in parking tax revenue in FY
2004-05, of which $33.09 million went to the General Fund and
$22.06 million went directly to the Municipal Transportation Agency
(MTA). Considering just the General Fund portion and not the millions
paid to the MTA, the downtown accounts for almost 80%, or about
$26 million, of General Fund parking tax revenue.
SAN FRANCISCO'S EXPLODING BUDGET - A Trend That Must Stop
From a policy perspective, the Board of Supervisors and special
interests have continually turned a blind eye to the inefficiencies
in municipal services delivery and the lack of cost containment
in City government. Instead of addressing these major issues as
taxpayers expect, some elected officials prefer to blame the City's
perennial budget deficit on the downtown not paying its alleged
"fair share." The graph below reaffirms the serious
spending problem in San Francisco as budgets rise year to year.
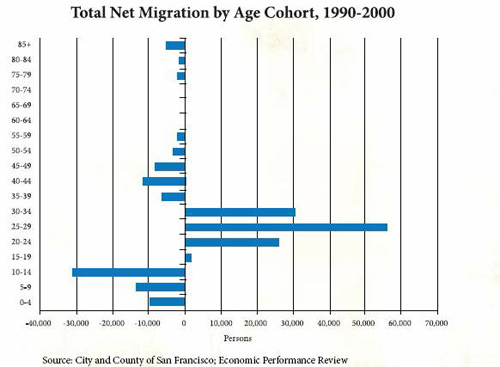
Even with the City's continued decline in population, San Francisco's
budget continues to grow-the City's rate of spending in FY 2004-05
equated to more than $10,000 every minute.14 In fact, San Francisco's
spending surpasses that of many states. The City and County of
San Francisco outspent the states of Mississippi and Vermont by
more than $1 billion and spent more than double the budgets of
Alaska and Idaho, respectively.15 Yet, the City's budget is set
to grow once again with the Mayor's proposed $5.73 billion FY
06 07 budget, a boost of more than 8%, or $400 million, over the
previous fiscal year's record-breaking budget.16
Figure 1 City Budget Increases
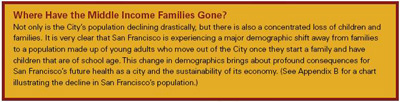
Meanwhile, as cities across the Bay Area and the state continue
to grow, San Francisco continues to lose residents. According
to the Census Bureau, San Francisco's population has now dipped
to roughly 739,000, as residents continue their flight to neighboring
cities and counties. All the while, San Francisco's government
spending has reached all-time highs.
Common sense tells us that with such a steady drop in population,
the City's spending should also fall. Unfortunately, even with
increasing spending and declining population, the City still received
only a C+ rating of its ability to provide needed services, as
documented in the annual City Survey of residents conducted by
the Controller's Office.18
Residents and businesses have become frustrated as they dig deeper
into their pockets to pay for more expensive services, while inefficiency
and waste slowly devour the City's coffers. According to the Controller,
overtime costs for FY 2005-06 are projected to reach $122 million,
which would again set a new City record. Moreover, the overtime
problem is widespread. The City's "Big Six" departments
are all projected to significantly outspend their overtime budgets
in the 2005-06 fiscal year, including Muni ($13.7 million), the
Department of Public Health ($8.5 million), and the Public Utilities
Commission ($4.3 million).
There are also major departments in San Francisco's local government
that have never been fully audited. Even after a request by Mayor
Newsom for an audit of the City's largest department-the Department
of Public Health-with more than 6,000 employees and a budget of
more than $1.2 billion, one has not yet been completed.20 Also,
a growing rate of absenteeism, particularly unexcused absences
at MUNI and the Department of Parking and Traffic, should cause
additional concern among all taxpayers.21
All of this reinforces the fact that San Francisco does not have
a revenue problem. It has a spending problem. In fact, tax revenue
has grown significantly (Figure 2). However, without better spending
controls and stricter enforcement of minimal workplace productivity
standards, there will never be enough. Residents and businesses
paying for these bloated budgets should be asking if the City
and County of San Francisco is doing its fair share.
So, as city leaders maintain their perennial stance that the
City must continue to impose new taxes and fees on the usual suspects
to feed their spending habit, San Franciscans must demand that
their elected leaders impose greater cost and efficiency controls.
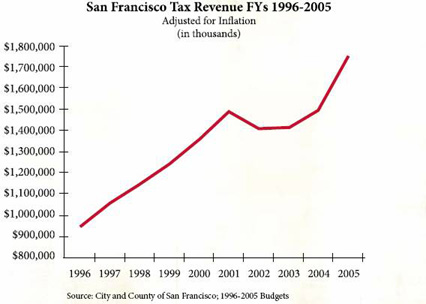
Figure 2: Will There Ever Be Enough?
CONCLUSION - Misaligned priorities mean a misaligned economy
Despite its usefulness for fueling poor public policy and runaway
spending, the myth that businesses don't pay their fair share
is no longer sustainable as a political excuse. For one thing,
San Francisco is in danger of losing its so-called "goose
that laid the golden egg" by creating a climate that is unsustainable
for businesses at all levels.
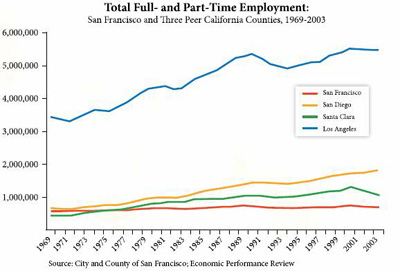
For example, when looking at job growth, the number of jobs in
San Francisco has actually increased only marginally since 1969
(see Appendix A).22 Even worse, the fastest growing job sector
in San Francisco is now referred to as "non-employers,"
or independent contractors. Currently representing 18% of all
private sector unrealistic expectations about the cost of service
delivery combined with a total disregard for how much is available
to spend.
The reality is that San Francisco has a systemic budget problem
that necessitates more revenue every year to fund an insatiable
appetite for creating new programs and hiring more workers without
a sustainable income stream.
While the political rhetoric has focused for years on faulty
assertions that the downtown does not pay its fair share, the
quantitative evidence is incontrovertible that the downtown and
the business community, in general, is indeed a major contributor
to the City's tax revenue stream upon which city services rely.
The employment in the City, independent contractor positions have
increased significantly, while employment has remained virtually
stagnant for more than 35 years. Put simply, the City's tax base
is eroding as the economy shifts from traditional corporate employment
to an economy comprised of "non employers." 23 The future
of San Francisco's economic well-being is in serious jeopardy
given the manner in which the City has chosen to fund its bloated
budgets. By finding new ways to tax, and imposing increasingly
onerous fees on those businesses and residents that remain here,
this erosion will only escalate.
Employment in the City, independent contractor positions have
increased significantly, while employment has remained virtually
stagnant for more than 35 years. Put simply, the City's tax base
is eroding as the economy shifts from traditional corporate employment
to an economy comprised of "non-employers." The future
of San Francisco's economic well being is in serious jeopardy
given the manner in which the City has chosen to fund its bloated
budgets. By finding new ways to tax, and imposing increasingly
onerous fees on those businesses and residents that remain here,
this erosion will only escalate.
If such a trend continues, the City will be left without an adequate
employer tax base to fund services.
As the Board of Supervisors continually passes legislation calling
for the expansion of services, they are creating a crisis in public
trust for our government. Policy and legislation based on ideology
rather than sound planning and management will always require
more revenue. This perpetual need, rather than the real problem
of overspending, has become the focus of discussion-creating downtown
makes up only 5% of San Francisco's total geographic area, but
provides much of the City's critical tax revenue, in some cases
double the amount of revenue collected from the rest of the City
combined.
Although many elected officials are confident that residents
and businesses will stay preferring to dismiss concerns using
a take-it-or-leave-it attitude-this type of governance has a disturbing
impact on the local economy and demographic makeup of the City.
The severe economic swings of boom and bust that San Francisco
has faced over the decades, coupled with the dangerous approach
by policy makers of assuming they can rely on the usual suspects
to supply a never-ending revenue stream, is not in the best interest
of San Francisco and the frustrated taxpayers that call this city
home.
As a result, residents and businesses are leaving and will continue
to leave until San Francisco can provide the quality of life and
services expected from a major metropolitan city with a budget
larger than that of 20 states in the union.
In the end, San Francisco's elected and appointed leaders must
learn to live within their means and stop their over-reliance
on local businesses to support their addiction to spending. The
core business infrastructure of the City should be seen as an
opportunity for economic growth and vitality as opposed to simply
a source of funding for unfettered government spending. San Franciscans
must demand that their elected officials set enforceable standards
to contain costs and that they become more efficient rather than
continuing to seek new and greater revenue through taxes and fees.
The question should not be whether downtown is paying its fair
share, but whether San Francisco, as a city, can better manage
its budget and provide services to its residents and businesses
without increasing taxes annually to pay for it. San Francisco
deserves better.
APPENDIX A
APPENDIX B
END NOTES
1 City and County of San Francisco; Mayor's FY 2006-07 Budget
Proposal
2 City and County of San Francisco; Office of the Controller
3 City and County of San Francisco; 2005 Comprehensive Annual
Financial Report
4 U.S. Census Bureau; www.census.gov
5 City and County of San Francisco; 2005 Comprehensive Annual
Financial Report
6 SF Prospector business data
7 SF Prospector business data and Economagic economic data, www.economagic.com
8 City and County of San Francisco; Office of the Controller
9 PG&E Tax Records
10 Real Quest Database
11 PKF Consulting
12 City and County of San Francisco; Office of the Controller
13 City and County of San Francisco; Office of the Controller
& Data From Local Parking Lot Operators
14 City and County of San Francisco; 2005 Comprehensive Annual
Financial Report
15 FY 2004-05 State Budgets
16 City and County of San Francisco; Mayor's Proposed FY 2006-2007
Budget
17 US Census Bureau; www.census.gov
18 City and County of San Francisco; Office of the Controller
19 San Francisco Examiner (5/27/06); "City overtime costs
soar to $122 million"
20 City and County of San Francisco; Office of the Controller
21 City and County of San Francisco; SF Stat
22 San Francisco recently conducted an Economic Performance Review
to assess current economic and demographic trends.
23 City and County of San Francisco; Economic Performance Review
####
|