Preliminary Maps of November's Ballot measures
By Marc Salomon
December 6, 2007
The Department of Elections has gone to court to secure an extension
from the Secretary of State from the statutory 28-day requirement
to produce a final statement of votes suitable for certification
by the Board of Supervisors. They have provided a preliminary
statement of votes which has been parsed to provide these maps.
Once final data are available, a definitive mapset will be produced.
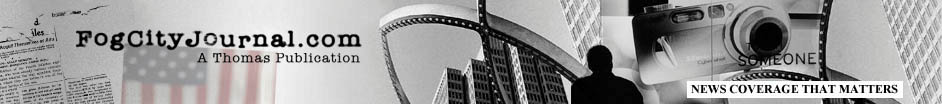
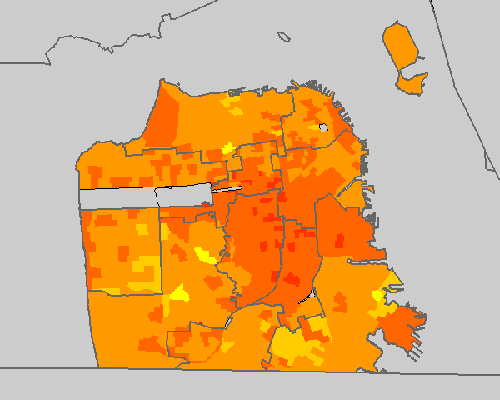
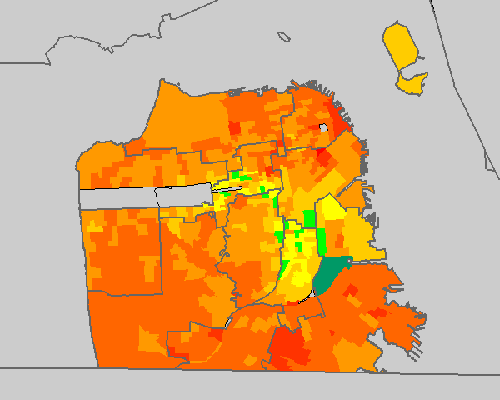
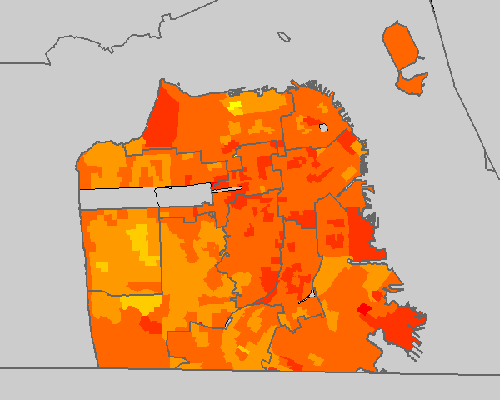
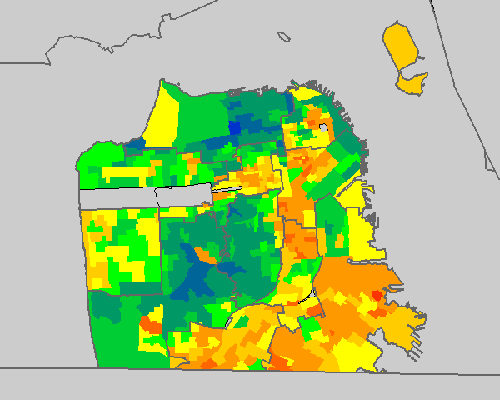
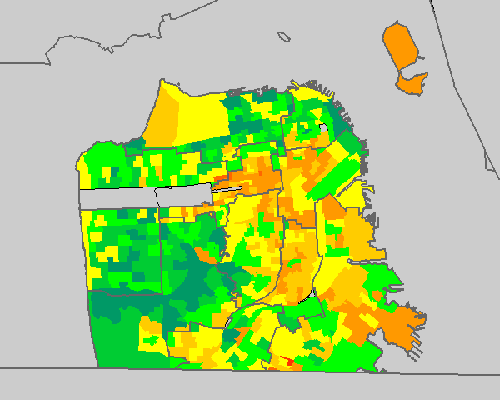
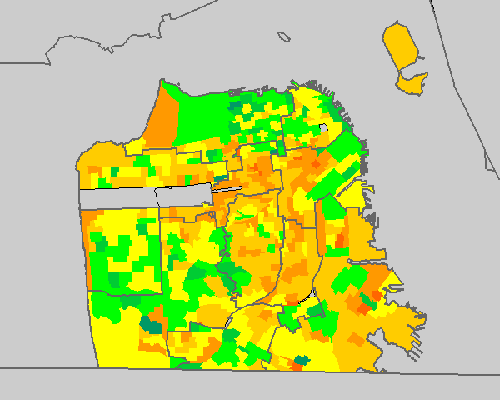
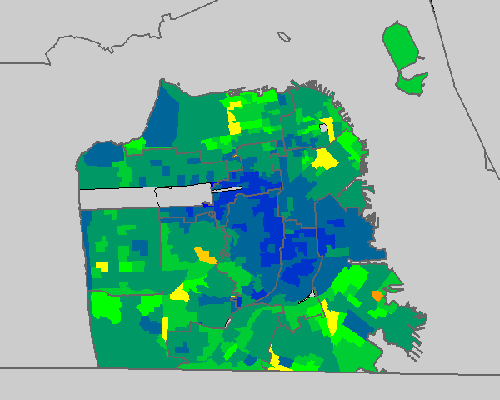
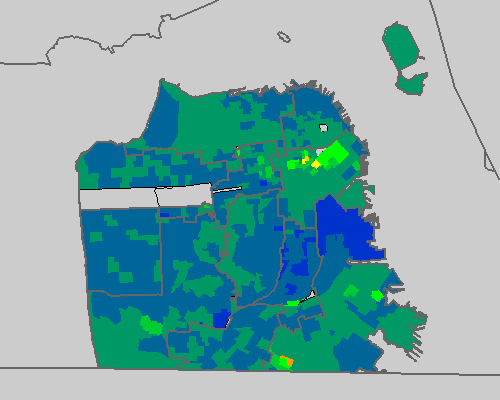
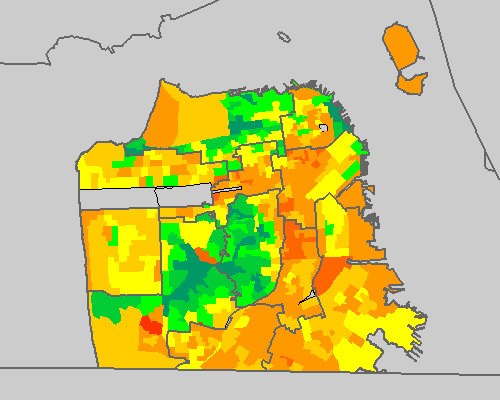
How to read the maps
Cooler colors are <= 50%, warmer colors are > 50%
Cooler colors run from dark to light blue through dark green
to light green.
Warmer colors run from yellow to orange and through red to dark
red.
Where light green and light yellow come together is the 50% boundary.
Since the interval between 40% and 60% is particularly interesting,
the lighter green and lighter yellow intervals are in increments
of 5% around the middle.
This scheme can be difficult to grasp but the difficulty is overcome
by the fact that it is able to present both detail on the swing
voters and the full extent of the extremes.
Warmer colors are shades of yes, cooler colors are shades of
no.
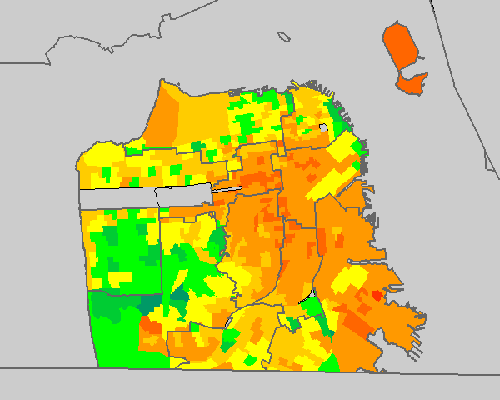
Prop A - MUNI Reform
YES: 78,209, 55.49%
NO: 62,733, 44.51%
10 20
30 40
45 50
55 60
70 80
90 100
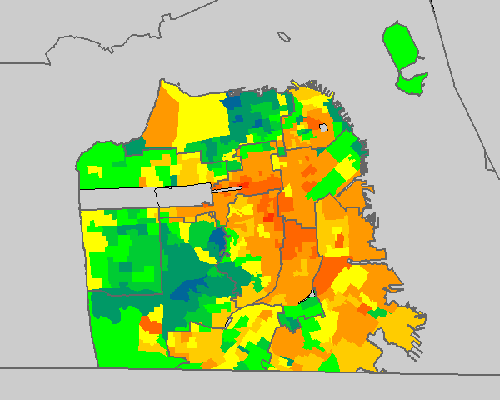
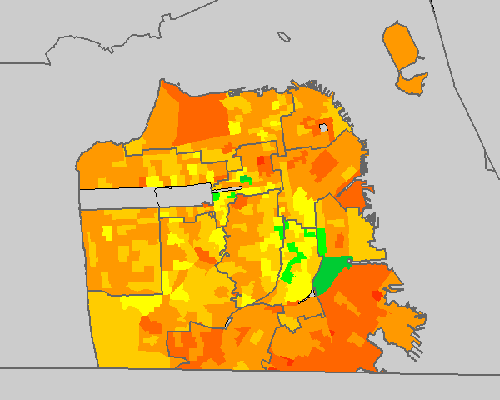
Prop B - Limit Holdover Appointments
YES: 95,799, 71.21%
NO: 38,739, 28.79%
10 20
30 40
45 50
55 60
70 80
90 100
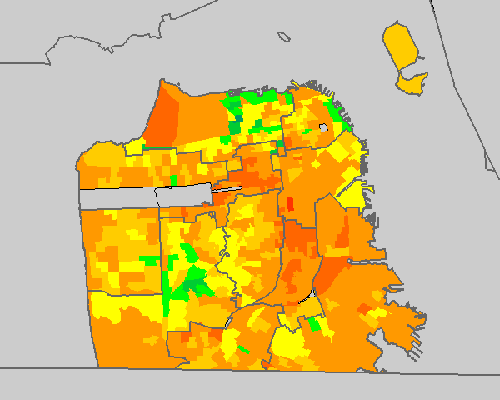
Prop C - Require public hearings before submitting ballot
measures
YES: 94,625, 68.19%
NO: 44,148, 31.81%
10 20
30 40
45 50
55 60
70 80
90 100
Prop D - Library Revenue Bonds on Budget
YES 105,032, 74.48%
NO: 35,986, 25.52%
10 20
30 40
45 50
55 60
70 80
90 100
Prop E - Question Time
YES: 68,419, 48.60%
NO: 72,354, 51.40%
10 20
30 40
45 50
55 60
70 80
90 100
Prop F - Airport Cop Retirement
YES: 68,044, 51.54%
NO: 63,985, 48.46%
10 20
30 40
45 50
55 60
70 80
90 100
Prop G - Golden Gate Park horse stables matching fund
YES 76,255, 55.39%
NO: 61,406, 44.61%
10 20
30 40
45 50
55 60
70 80
90 100
Prop H - Parkacoplypse? Not now!
YES: 46,558, 33.05%
NO: 94,314, 66.95%
10 20
30 40
45 50
55 60
70 80
90 100
Prop I - Small Business
YES: 80,804, 59.13%
NO: 55,844, 40.87%
10 20
30 40
45 50
55 60
70 80
90 100
Prop J - Free WiFi
YES: 86,402, 62.26%
NO: 52,373, 37.74%
10 20
30 40
45 50
55 60
70 80
90 100
Prop K - Advertising in Public Space
YES: 86,197, 61.84%
NO: 53,191, 38.16%
10 20
30 40
45 50
55 60
70 80
90 100
Comparisons
Comparison maps are presentations of two maps that cycle in animation
so that one might compare results. When a precinct or neighborhood
flashes from cold to warm, that indicates a neighborhood flips
its position between the two measures. Soon, I'll learn how to
label the maps easily, until then, accompanying text indicates
which map is which measure based on results.
Workforce Housing compared to Parkopalypse: Prop J (Workforce
Housing, Mar, 2004) cooler, Prop H (Parkopalypse, Nov 2007) fared
better because there are some warm spots.
10 20
30 40
45 50
55 60
70 80
90 100
A Tale of Two Question Times, Two Electorates - 2006 Prop
I vs. 2007 Prop E
District Eight and Potrero key to covering Newsom's vulnerabilities.
Prop I first, Prop E Second. You do the math.
See how the Surfer and Hansen strips vote progressive unwaveringly
just as the D2 strip asserts its class interests irrespective,
just as D7 support withers. See how the east SOMA condo dwellers
respond to red flags.
What is remarkable here is that Prop E sailed through in Districts
10 and 11 and didn't do half bad in D4, which are traditionally
not progressive strongholds. D3 support is strained but solid.
Could the Mayor's focus on service delivery to his white base
to the exclusion of districts that supported him in 2003 have
almost cost him his face?
Note that white voters rode to Newsom's rescue here, as communities
of color in D4, the Western Addition, Chinatown, D11 and Bayview/Hunters
Point, and, of course, The Mission, supported Prop E.
The warmer map is Prop I, the cooler map is Prop E
10 20
30 40
45 50
55 60
70 80
90 100
Win versus Loss
10 20
30 40
45 50
55 60
70 80
90 100
When we do well versus when we fall short:
Prop A vs. Prop E
Note the differences where progressives are susecptible to sway.
The northern margin between D8 and D5 is a stark contrast. Looks
like D4 is cooler on MUNIreform than on Question time. Maybe the
MUNI plagued district figures the best way towards MUNI reform
might involve questioning the Mayor on television.
A is in warmer colors and wins, E is in cooler colors and loses.

Permalink
####
|